To become a profitable trader, you have to invest years and years of practice and commitment to price analysis. So, the types of charts you see daily and the drawing software you use probably play a significant role in the development of your business. However, trend lines, ascending and descending channels, patterns, and chart colors are things you have to master if you want to become a better trader and increase your sales.
Further, there are plenty of ways to trade using technical analysis. Also, that makes it very challenging and complex to find what works for you. It is expected that some trading styles may not suit your innate abilities or even your daily life. However, analyzing and getting into your business, insight into what you did well and what wrong is all a process to profitability.
Also, we have to mention that graph can help us to see things visually. With diagrams, you can shorten the time required to compare a large number of numerical data: offers, prices, plans, sales, revenue, expenses, turnover, and many other applications! If you are not a fan of Excel, here are great online alternatives that allow you to gain quick insight into your data visualization.
1. Visme
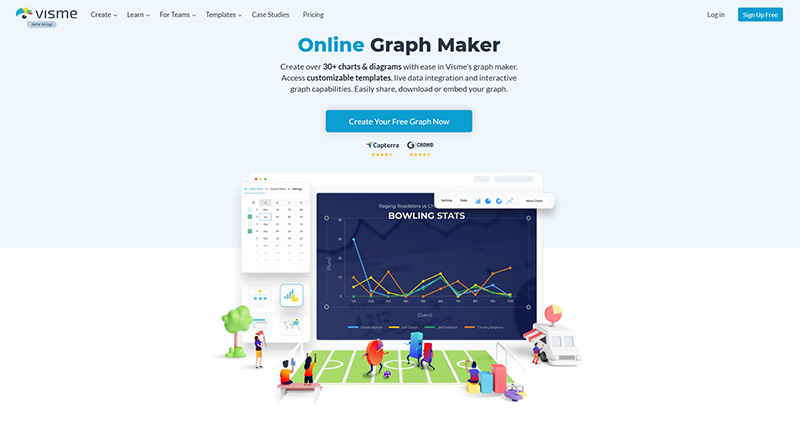
Visme is an all-in-one design tool that was created to help people make their content more visually appealing. Especially when it comes to graphic design. Graph maker would be the right choice both for professional designers and people who have no experience in graphic design at all. What can you do with the graph maker tool from Visme?
It allows you to make bar graphs, pie charts, flowcharts, diagrams, line graphs, histograms, and everything in between. Plus, you can import data in a few seconds and switch between different types of graphs to find the best presentation of your data.
What’s more important, creating a graph with Visme’s graph maker is 100% free. Everything you will have to do is to sign up for a free account, choose a graph template or start from scratch using a powerful graph editor, which gives you full granular control over your graph settings, including data, colors, fonts, legends, and more. If you want to use premium graph templates and features, you can upgrade to a Standard or Business plan.
Besides, you will have an opportunity to download your graph in multiple formats, including JPG, PNG, PDF, and HTML5. Use it as an online project, print it, or add it to other projects like reports and presentations. You can also share your graph online with a link or embed it using a snippet of code.
2. Canva
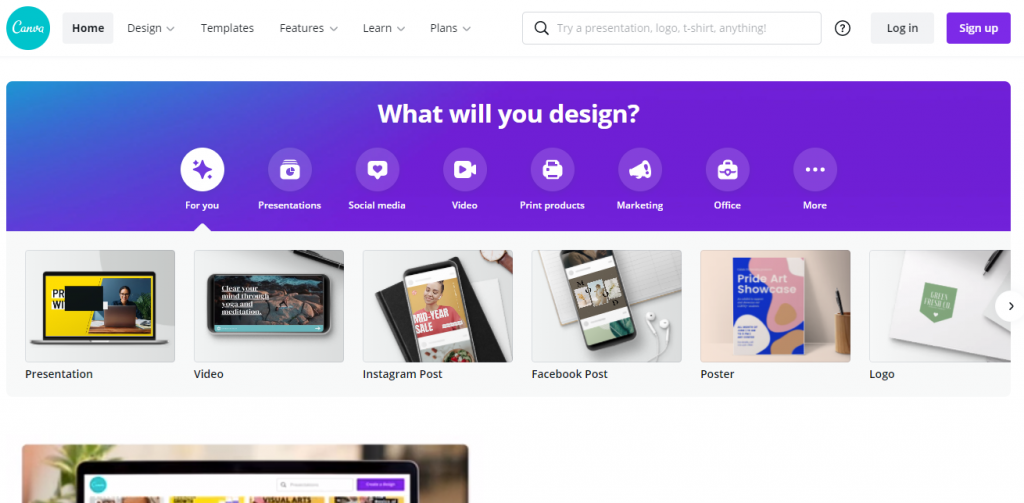
Canva is a high-speed and comfortable web tool for graphic design. However, it is meant for people who don’t have expensive tools or even knowledge to use them. However, they would like to give their presentations, posters, and also infographics a professional look.
Canva provides pre-defined templates (poster, greeting card, infographic, presentations, etc.) and also the ability to define your dimensions. The main goal of this tool is to provide the user with a large set of resources (images, icons, fonts) to find what he wants to design according to his idea.
However, it is vital to mention that the users can use free resources, and resources marked as premium are $ 1. Also, the user can register classically: by e-mail or using his Facebook or Google account. Further, after selecting the design or defining your dimensions, a document editing interface opens where you can get acquainted with the functionalities with the help of a few short user instructions.
The top toolbar contains standard functionalities such as file settings, “Undo” and “Redo” options, and defining settings for sharing. There is also the possibility to publish a document and saving it on a computer. With Canva’s help, you can make phenomenal graphs online, keep them on the cloud, have them available at all times. And what makes it even more attractive is that you don’t need special knowledge of graphic design.
3. Crello
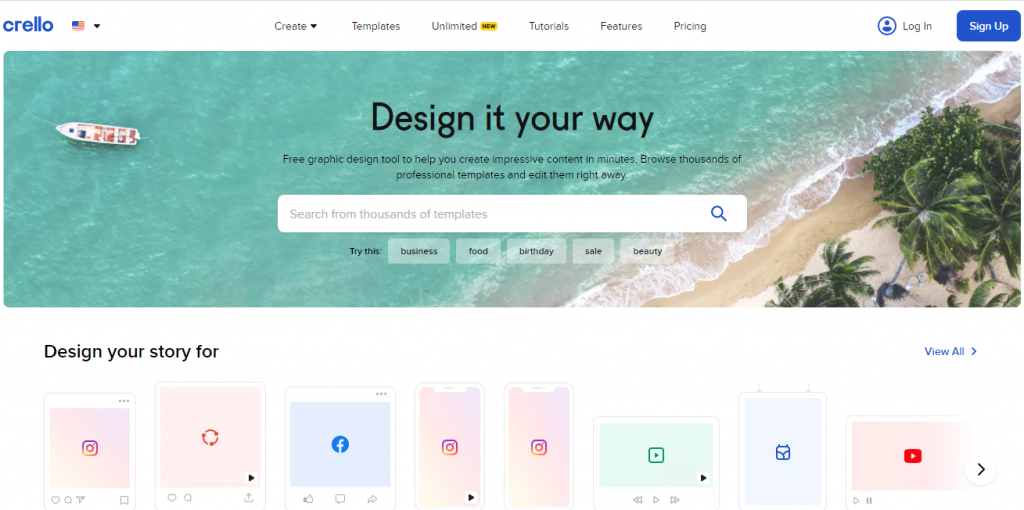
Crello is the most straightforward tool for creating animations and graphics for social networks and the web. It will allow you to create incredible photos, both for social networks and for other web-based graphics. If you decide to give this tool a shot, we will mention it right away; you don’t need any design skills to use it.
Also, this tool will help you to upgrade your infographics game. You can create a modern-looking infographic with this tool. There are several pre-made templates, or design your own, how you imagined it!
Crello is available with thirty-three different formats and tens of thousands of free schedules for creating professional visuals. Unlike Canva, which calls the charts Elements, in Crello, they are easy to find in the Objects group. Crello has almost the same interface as Canva, but you cannot collaborate with others since it is designed for one user. So if you need a quick and easy solution, it is a great tool that you can use.
On the other hand, if you need a proper collaboration tool, then you should consider using something like Asana along with Crello.
4. Piktochart
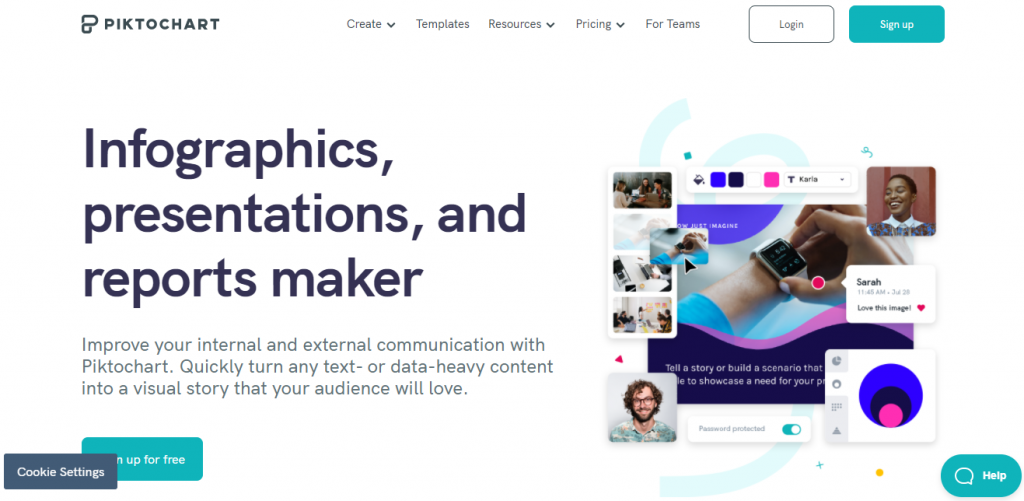
Piktochart is an online tool for creating infographics, reports, posters, and presentations. Lately, making infographics has become popular due to their easy display on blogs and websites. The tool simply displays a variety of data that would otherwise be tedious to the user.
Piktocart aims to help with creating information materials for the user, enabling them pre-made templates and graphics. After you successfully register or log in, this tool will allow you to choose four forms of infographics: infographics, reports, posters, or presentations. By choosing one of the formats, you will be able to choose from several free templates. Also, you have the possibility of creating without a template.
The tool can load your files which can be images, icons, etc. The free storage account size is limited to 40 MB. Another option is to choose the infographic background, and you can choose between color or offered images. Adding text will provide you a choice between several formats: title, subtitle, or plain text, and adding a text box.
Also, classic text formatting is available in addition to these formats: selecting the font type, size or shape, and aligning the text.
Further, it is essential to point out that there is a possibility of choosing between several things. There is a chance to add graphical representations of data (different types of graphs), add videos and maps, or add essential data and charts. The last option is also one of the latest addition to the tool.
This addition allows the user to connect to the SurveyMonkey tool and directly import data from surveys or questionnaires. The Piktochart then automatically creates charts from the questionnaire with a simple drag and drop action. If you are someone who does many surveys or questionnaires, this tool is perfect for you, and we recommend you give it a shot.
5. Genially
Genially is an online tool designed for creating presentations, interactive images, infographics, video presentations, etc. This tool adds dynamism to already known formats through interactivity, animations, and multiple integrations. To use this tool, you will have to register to the system by creating a new account or Facebook, Google, LinkedIn, or Twitter accounts. Also, you can easily log in via an Office 365 account.
Selecting any of the available content types offers the option of choosing attractive pre-made templates, but you can also choose to create without a template. A decent number of free templates are available in the free version of the tool, and it is possible to choose to display free or premium (marked in yellow).
6. Infogram
Infogram is a program that enables the creation of infographics, charts, various types of reports, presentations. Also, you can create visuals for the social network Facebook. They have a large selection of urns, as well as a large selection of photographs. In addition to the free version, they also offer other paid packages starting at $25/month.
Infogram offers free infographic templates to help you display information in a reporting schema, as statistical information, a timeline, or a data map. The Infogram offers other blueprints that could be useful for presenting the information. Also, there are basic templates for monthly and annual reports.
Conclusion
Business people discuss charts and graphs that show the results of their successful teamwork. However, business overviews on charts enable accurate and straightforward business monitoring by analysts, customers, and employees. They are obtained based on accounting data.
Also, they are made based on business indicators, which determine which data from the bookkeeping we want to present. If we talk about system charts, each user can create indicators and reports on the charts according to their needs and desires.
However, if you want to make charting easier for yourself and make the job exciting and creative, we have shown you five tools with which you will create your charts that everyone will love! It is up to you to discover more similar tools and brighten up your workday with new knowledge.