In today’s fast-paced world of investing and finance, staying updated with the latest stock prices is crucial. Whether you’re a casual investor keeping an eye on a few shares or a financial analyst tracking multiple tickers, having access to real-time stock data can help you make informed decisions. What if we told you that you could do all this within a tool you already know—Google Sheets? Thanks to the built-in GOOGLEFINANCE function, tracking stock prices is both efficient and highly customizable.
What is the GOOGLEFINANCE Function?
The GOOGLEFINANCE function is a powerful feature in Google Sheets that allows users to import real-time stock market data directly into a spreadsheet. It pulls in data straight from Google Finance, providing insights into stock prices, company information, historical market trends, and more.
By using this function, you can turn your normal spreadsheet into a dynamic financial tracking tool, complete with automatic updates and custom visualizations.
Why Use Google Sheets for Stock Tracking?
Google Sheets provides a perfect blend of flexibility, accessibility, and simplicity. Here are just a few reasons why it’s ideal for tracking stock data:
- Real-time updates – See today’s stock price without having to refresh or visit a separate website.
- Custom dashboards – Using spreadsheet functions and charts, you can create your own personalized stock monitoring tools.
- Cloud access – Access your financial tracker anytime, anywhere, on any device.
- Integration – Easily connect with other Google services and third-party applications.

Basic Syntax of the GOOGLEFINANCE Function
Here’s how you write a basic Google Finance formula in a cell:
=GOOGLEFINANCE("TICKER", "ATTRIBUTE")
“TICKER” is the stock’s symbol, such as “AAPL” for Apple Inc., and “ATTRIBUTE” determines what kind of financial information you want. Both parameters should be enclosed in quotation marks.
For example:
=GOOGLEFINANCE("GOOGL", "price")
This will return the current stock price of Alphabet Inc., the parent company of Google.
Popular Attributes You Can Track
Here are some commonly used attributes with GOOGLEFINANCE:
- “price” – Current trading price
- “volume” – Trading volume for the day
- “high” – Day’s high price
- “low” – Day’s low price
- “marketcap” – Market capitalization
- “pe” – Price-to-Earnings ratio
- “eps” – Earnings per share
Using these attributes, you can build a detailed financial overview of your desired stocks—all within a single spreadsheet.
Example: Creating a Simple Stock Tracker
Imagine you want to track five tech stocks: Apple, Google, Microsoft, Amazon, and Tesla. In Google Sheets, you could organize your spreadsheet like this:
- Column A: Stock Ticker
- Column B: Company Name
- Column C: Current Price
- Column D: 52-Week High
- Column E: 52-Week Low
In each row, enter the relevant ticker symbol in Column A. Then, use formulas like these in the other columns:
=GOOGLEFINANCE(A2, "price")
=GOOGLEFINANCE(A2, "high52")
=GOOGLEFINANCE(A2, "low52")
Copy the formulas down for all the stocks, and just like that, you’ve created a basic and functional stock tracker!
Tracking Historical Stock Data
Another useful feature of GOOGLEFINANCE is the ability to retrieve historical data. This can help you analyze stock trends over a specific time period. The syntax looks like this:
=GOOGLEFINANCE("AAPL", "close", DATE(2020, 1, 1), DATE(2020, 12, 31), "DAILY")
This formula will return Apple’s closing stock prices for every trading day in 2020. The data arrives as an array of dates and prices, which you can then graph using Google Sheets’ built-in chart tools.

Creating Visual Dashboards
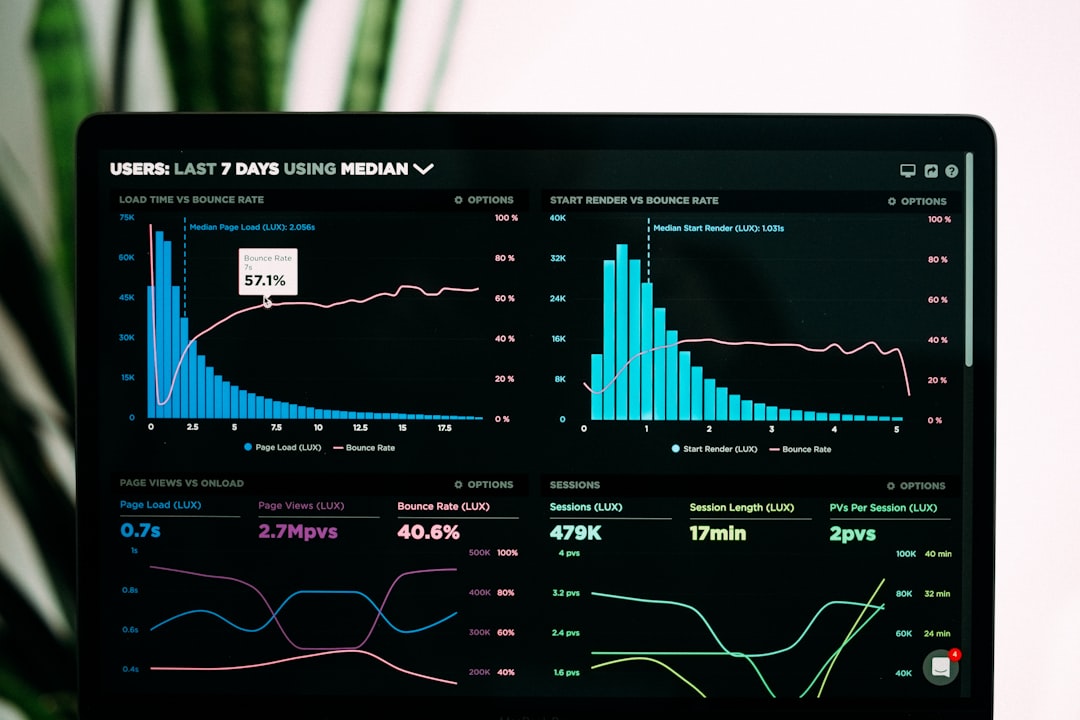
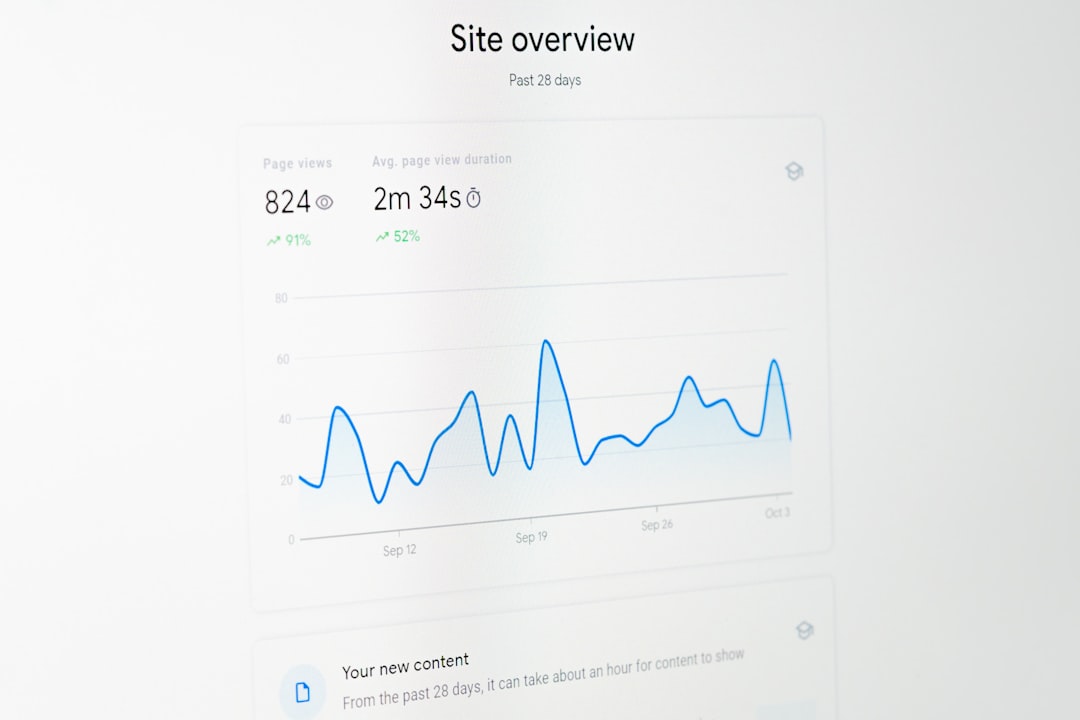
Data is powerful, but visualizing it takes it to another level. By incorporating charts and conditional formatting, you can build interactive dashboards that help investors see patterns and trends at a glance.
Some possible charts to include in your dashboard:
- Line charts of historical prices
- Bar charts showing price comparisons between companies
- Pie charts for portfolio allocations
You can set up conditional formatting in Cells to highlight when a stock’s price rises above or below a certain threshold, making the dashboard even more actionable.
Limitations and Considerations
While GOOGLEFINANCE is incredibly helpful, it’s important to be aware of a few limitations:
- Delayed data – Unlike professional trading systems, data might be delayed by up to 20 minutes.
- Not all tickers supported – Some exchanges or international stocks might not be available.
- Historical data gaps – Availability of historical data might be limited, especially for older dates or specific attributes.
Despite these limitations, for personal tracking and casual analysis, Google Sheets with GOOGLEFINANCE is still an excellent free solution.
Tips for Advanced Users
If you’re ready to go beyond the basics, consider these tips:
- Combine with Google Apps Script – Automate workflows, send daily reports or set alerts.
- Import CSVs or APIs – Use IMPORTDATA or Apps Script to bring in data from other services.
- Use Data Validation – Create dropdowns for selecting stock tickers to improve usability.
These techniques transform your spreadsheet from a passive display into a smart, interactive tool tailored to your financial strategy.
Conclusion
Whether you’re a beginner learning about the stock market or a seasoned investor managing a diversified portfolio, integrating GOOGLEFINANCE with Google Sheets is a smart and effective way to stay updated. It’s free, it’s customizable, and it brings the world of finance to your fingertips.
So go ahead—open a new spreadsheet and start tracking your favorite stocks. With a few simple formulas and a bit of creativity, you’ll have your own financial dashboard in no time.